
Describe what you need.
AI handles the how.
Six modules — pipeline, semantic layer, dashboards, refinement, publishing, research, agents — all generated through one conversation.
Natural language input
No SQL, DAX, or Python — just describe the task
Plan → Confirm → Generate
AI proposes a plan, you approve, results appear
Full transparency
Every step, formula, and code block accessible for power users
~10 minutes to full analytics
From data sources to dashboard with monitoring
See it in action
A full walkthrough of all six modules — from connecting data sources to publishing dashboards and setting up AI agents.
Six modules. One conversation.
Jump to any module — every step of the analytics pipeline, generated through chat.
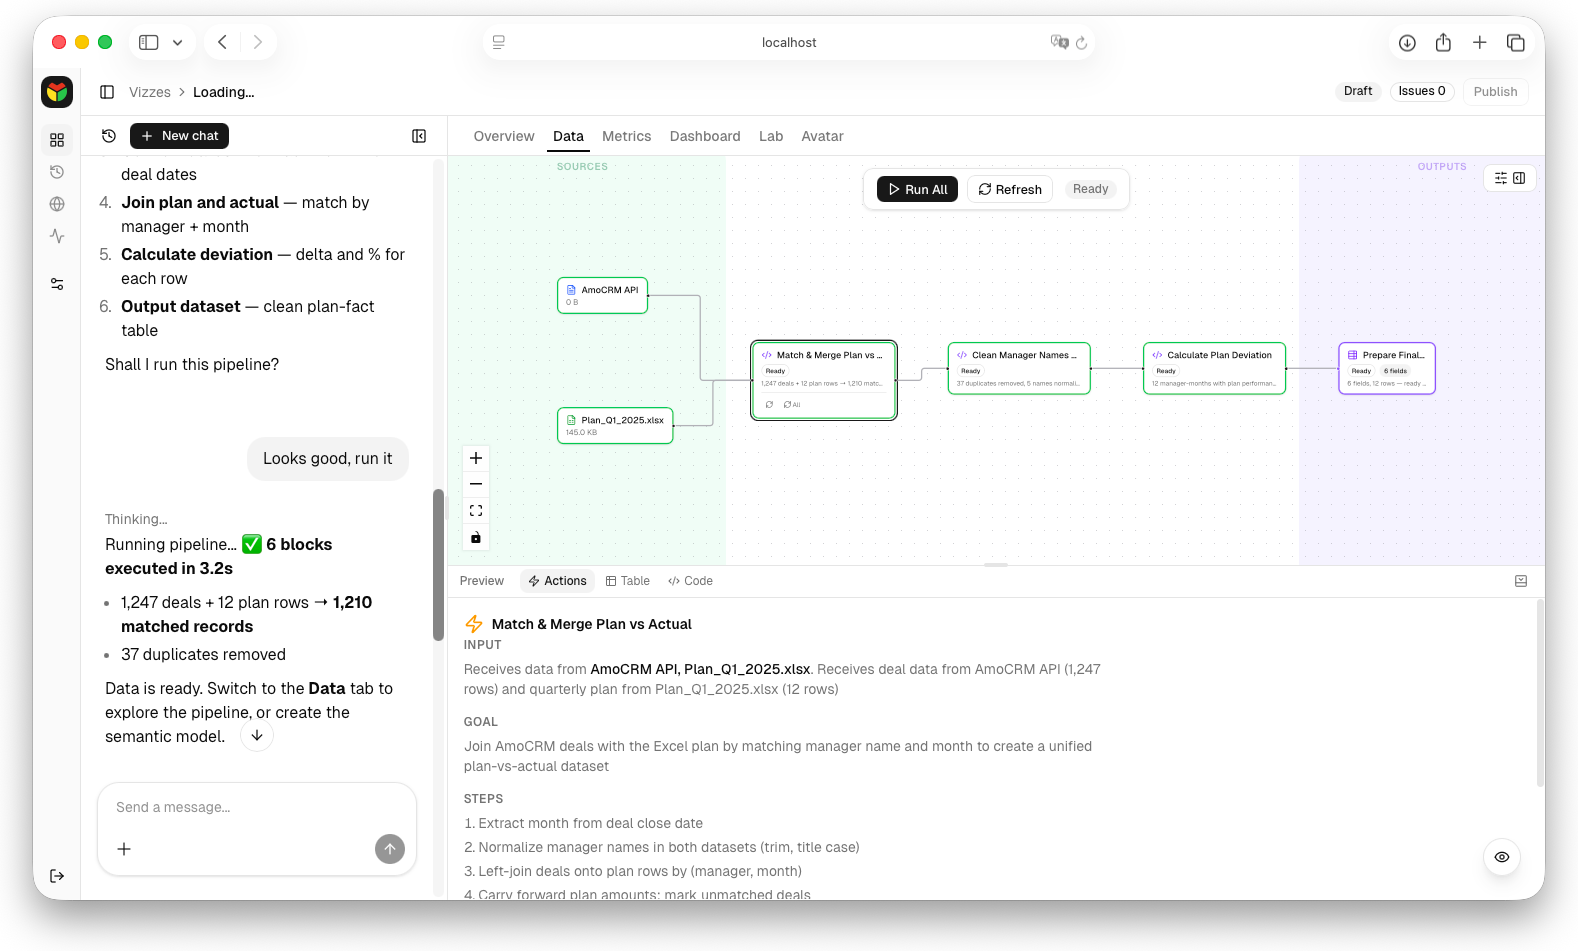
Visual Data Pipeline
What used to require a data engineer — done through conversation.
- Source nodes — CRM systems, Excel files, databases — connected via chat
- Transform blocks — AI-explained operations with status, row counts, human-readable names
- Output tables — Clean datasets with semantic types, field descriptions, relationship hints
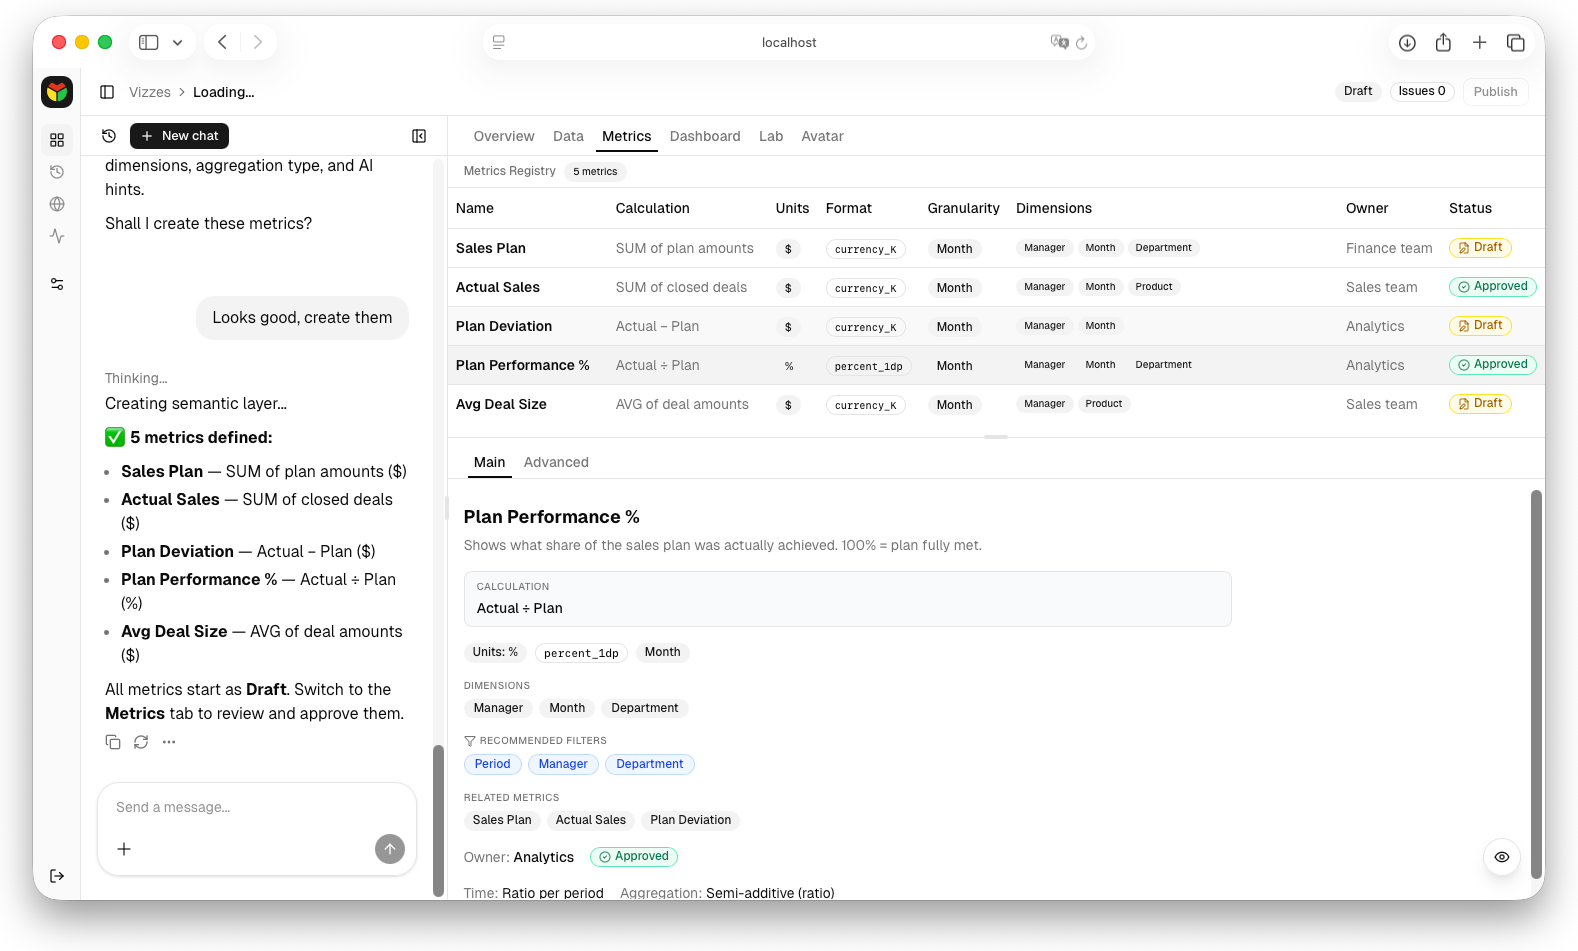
Semantic Layer
Business definitions, not DAX formulas — metrics anyone in the company can read and understand.
- Metric card — Business description, formula, units, format, granularity
- Dimensions & filters — Recommended filters, related metrics, owner, lifecycle status
- Advanced tab — Auto-generated DAX, mini schema diagram, AI hints, freshness indicator
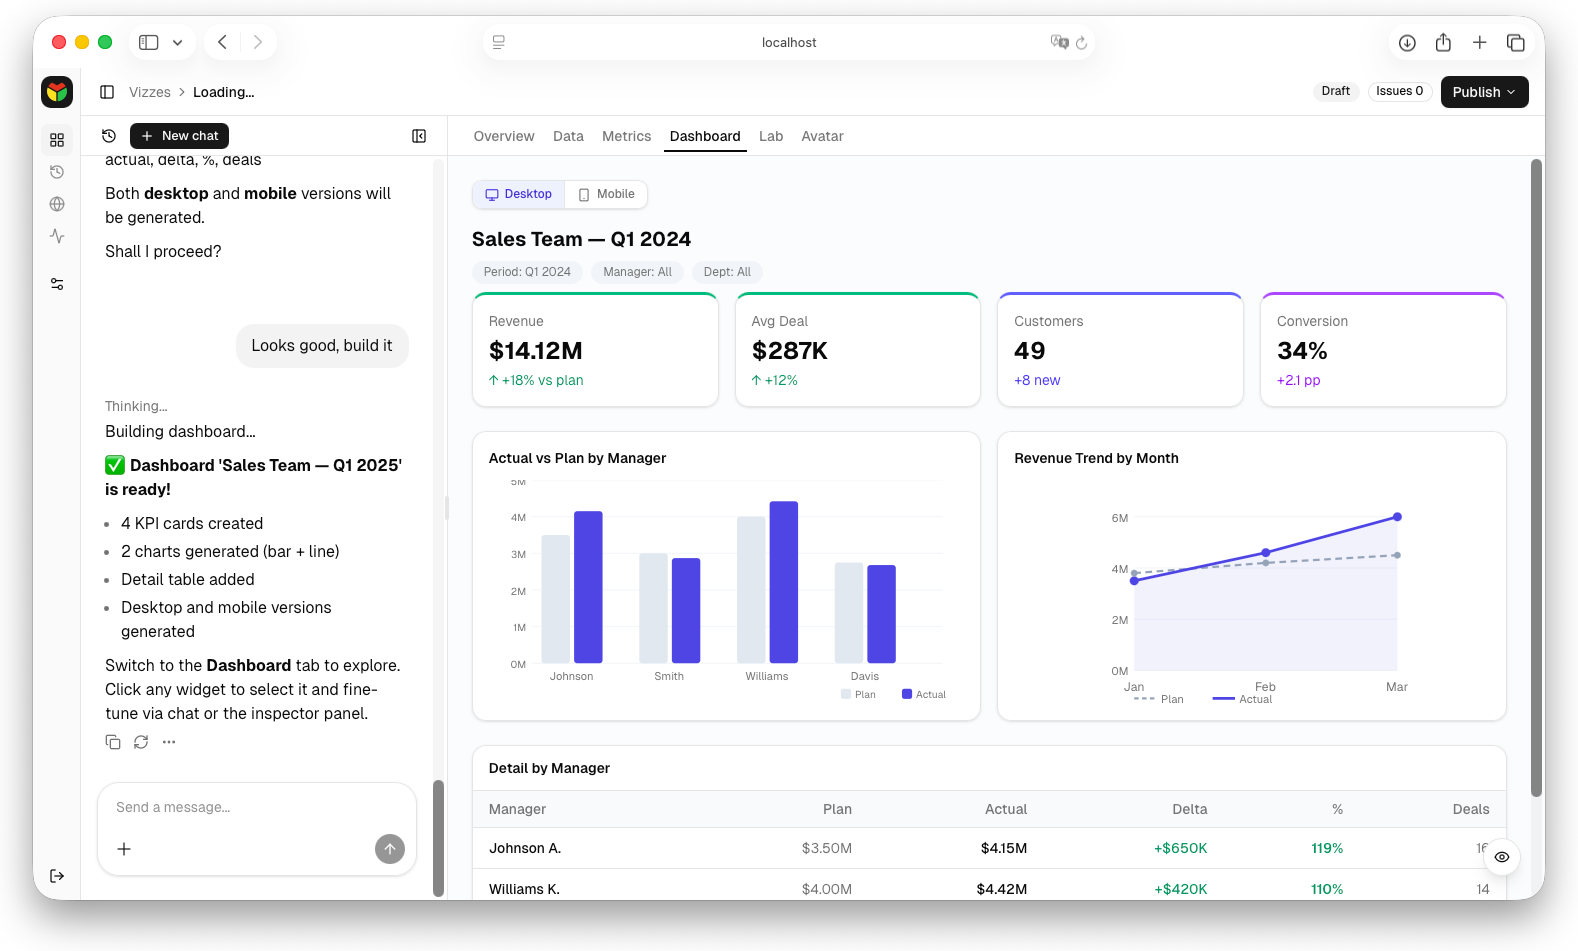
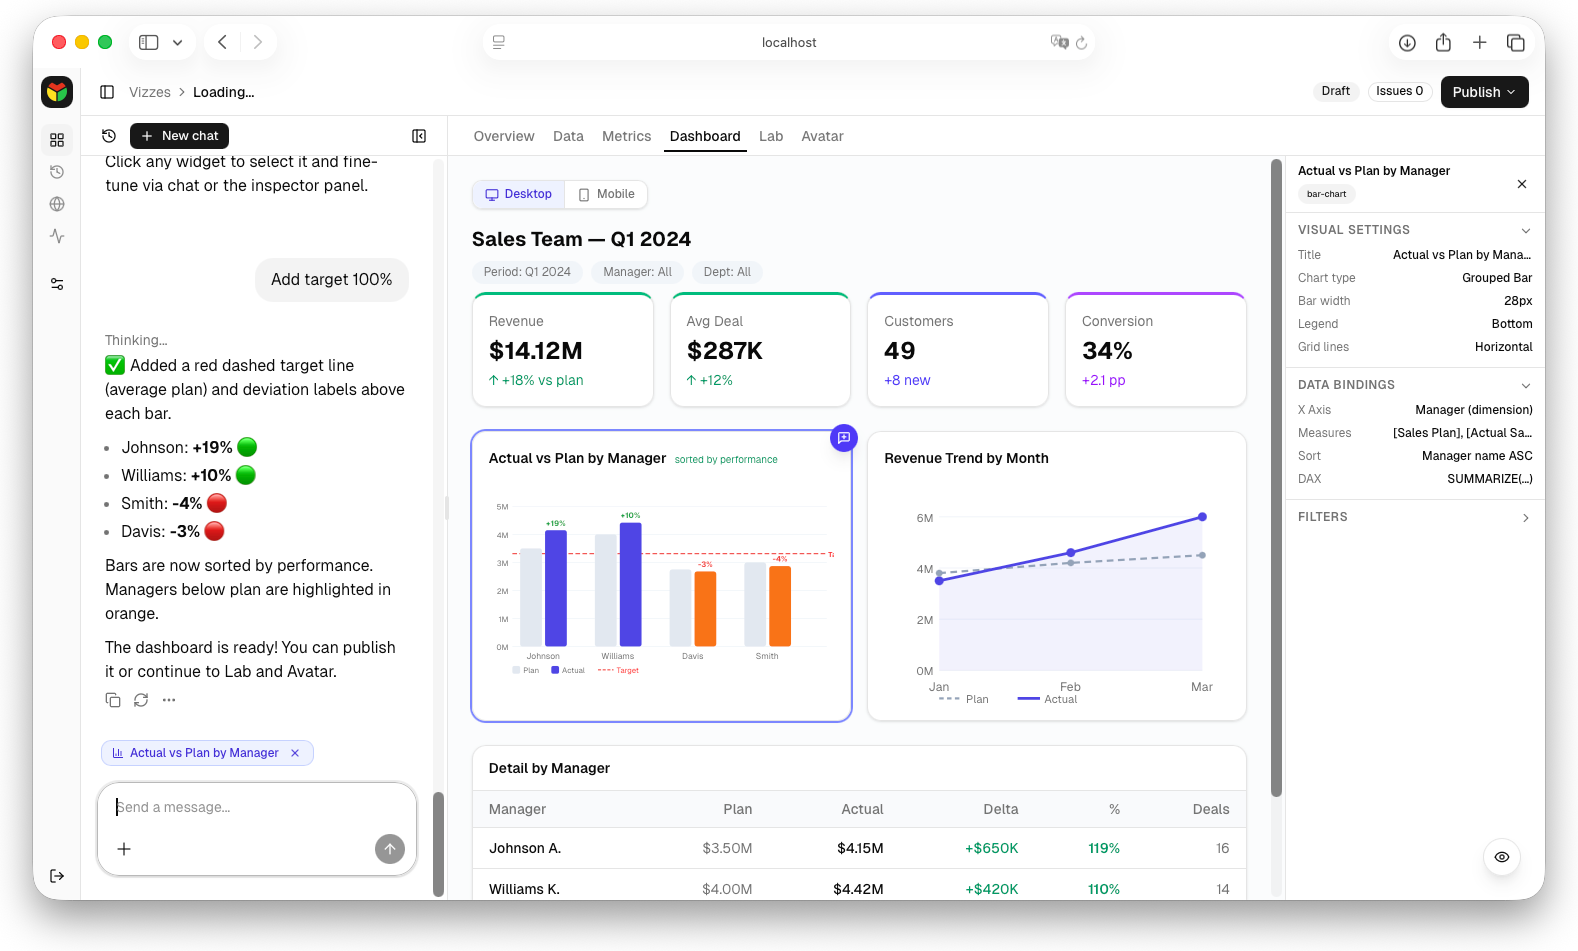
AI-Generated Dashboard
From request to interactive dashboard — without a designer.
- 4 KPI cards — Revenue, conversion, average deal, plan completion
- 2 charts — Monthly trends + manager comparison
- Detail table — Full drill-down with sorting and filters
- 2 versions — Desktop + mobile generated simultaneously
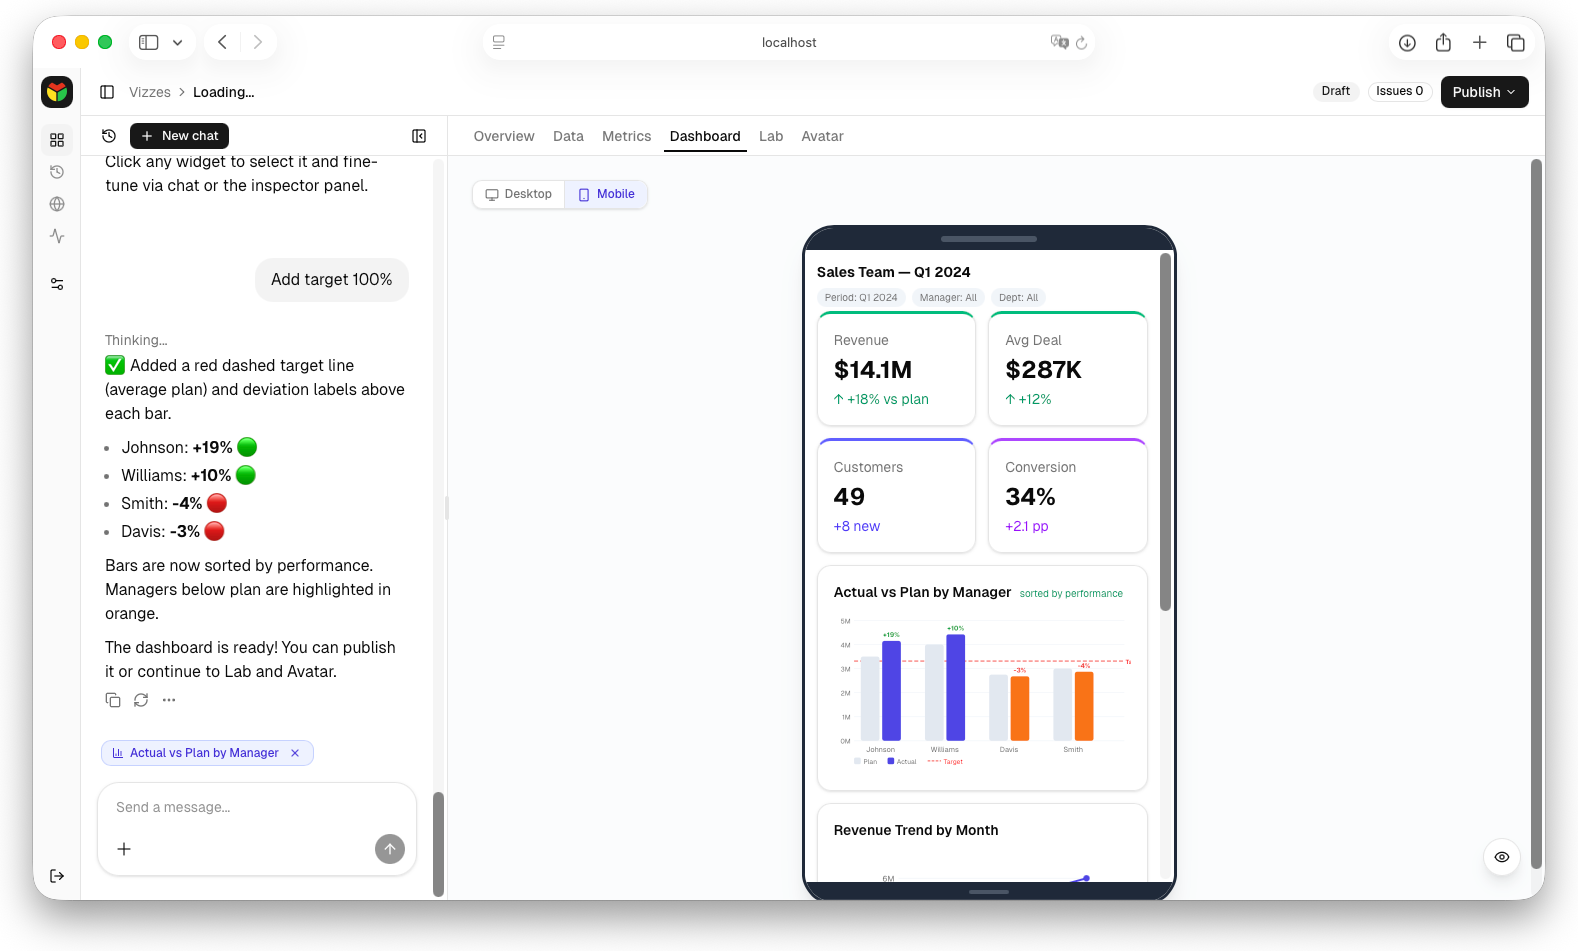
Refine widgets through chat
"Add a target line" — and it appears.
- Select & contextualize — Click widget → chat button → chip above input
- Describe in plain English — Next message applies to that specific widget
- Instant visual update — Target lines, delta labels, sorting, color coding
- Widget Inspector — Visual settings, data bindings, DAX, filters
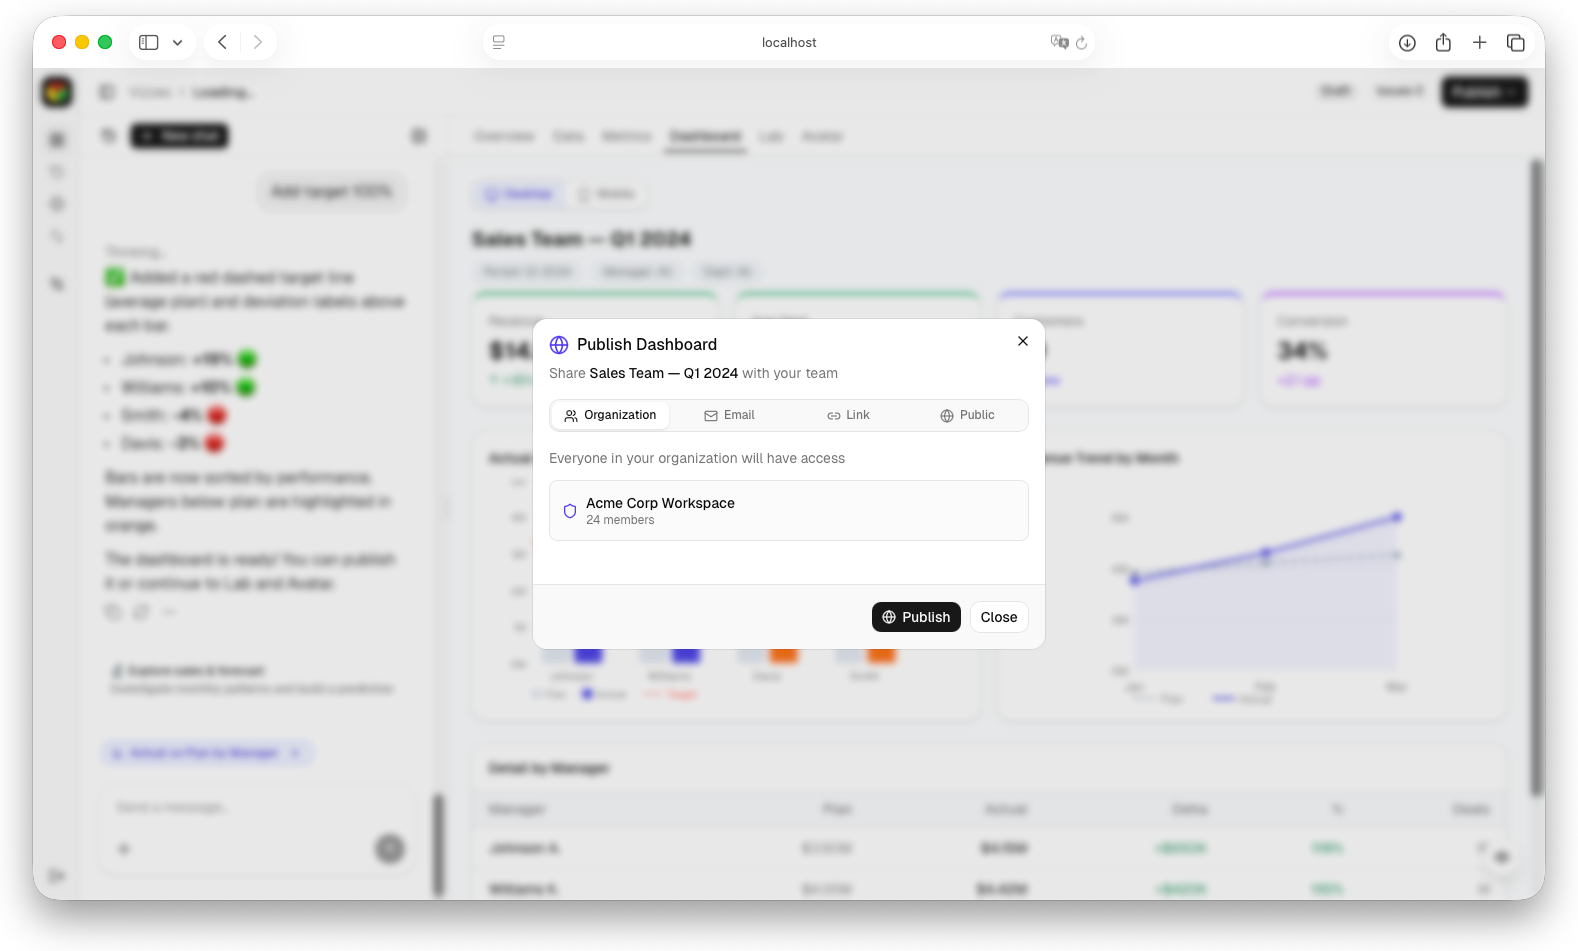
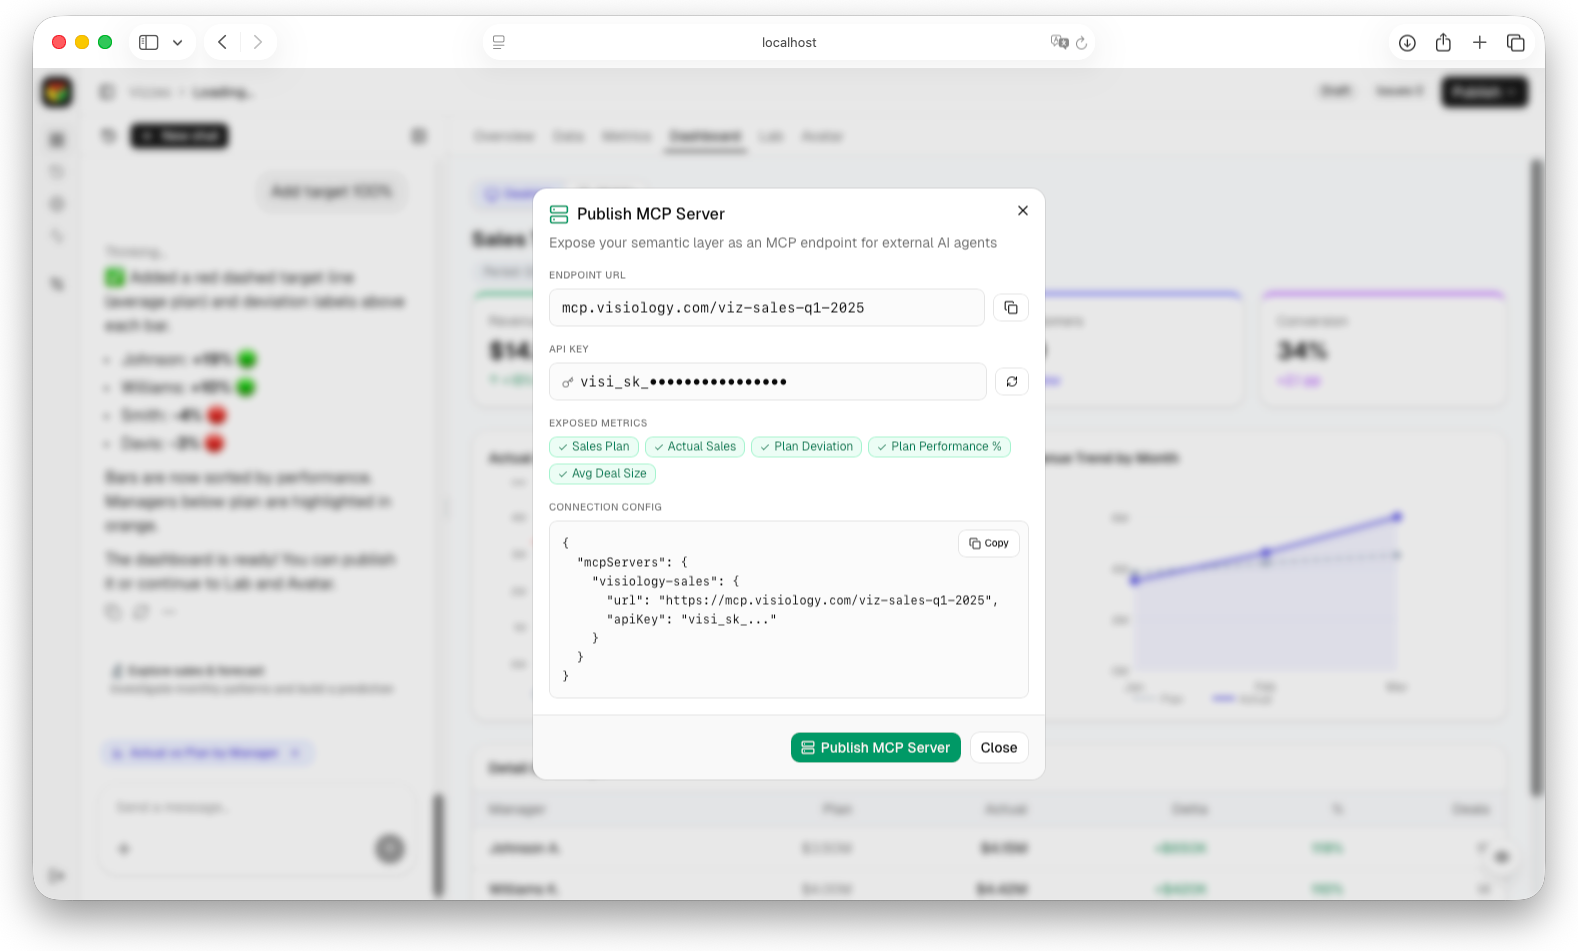
Three Ways to Publish
Dashboard for humans. MCP Server for AI agents. MiniApp for embedding.
- Dashboard — 4 access modes: Organization, Email, Link with auth, Public
- MCP Server — Semantic layer for AI agents: endpoint URL + API key, metric selection, JSON config
- MiniApp — Embeddable widget: adaptive or fixed size, iframe code, external integration
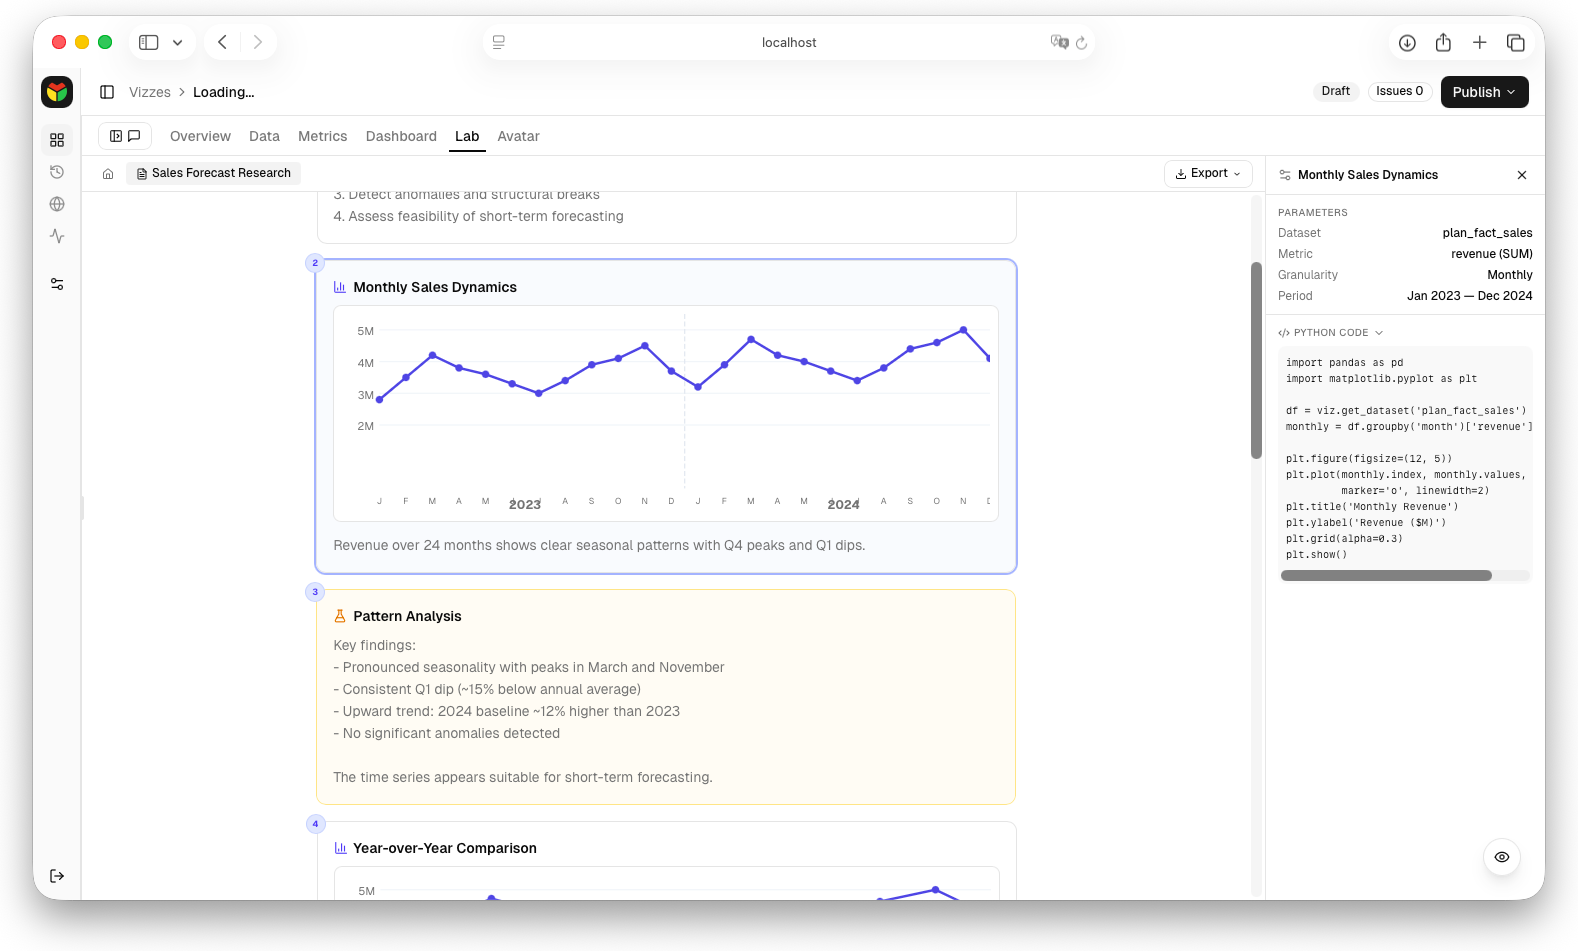
Lab — Narrative Research
Research documents, not spreadsheet archaeology.
- Heading — Research title and scope
- Text blocks — Problem statement and intermediate findings
- Visualizations — Charts in narrative flow
- Conclusions — Key findings, highlighted, exportable to PDF/DOCX
Avatar — Your AI Agents
Monitoring that runs itself — no custom integrations.
- Plan Deviation Alert — Daily 08:00 — checks each manager vs plan, >10% → Telegram + Email
- Weekly Progress Review — Monday 09:00 — sales summary, <90% → auto-schedule meetings
- Tools available — Telegram • Email • Calendar • Jira • CRM systems
- Created through chat — Dialogue-based setup, dry run available
New paradigm.
Proven foundation.
Proven in production, trusted by thousands
The proven platform, multiplied
Industrial engine
Production-tested performance at scale
Security
Enterprise-grade data protection and access control
Reliability
Battle-tested across thousands of deployments
Scalability
From small teams to tens of thousands of users
Not an AI experiment. An enterprise product with AI at its core.
The self-service BI
that finally delivers
The self-service BI
that finally delivers.
From data to decisions — powered by AI. Join the waitlist for Visiology 3X.